ANALYSING TRANSPARENCY DATA FROM CMS
Healthcare manufacturing companies often collaborate with Healthcare Professionals (HCPs) and Hospitals on a range of activities from clinical research, sharing best practices and exchanging information on their drugs or devices. Sometimes, these collaborations lead to financial relationships that can include gifts, speaking fees, meals, travel, or money for research activities. Some financial relationships between manufacturers and doctors are necessary and beneficial, and reflect the collaboration between medicine and industry that generates new knowledge and advances patient care. Other gifts and payments—those associated with marketing—add expense to already unsustainable health care costs and create conflicts of interest.
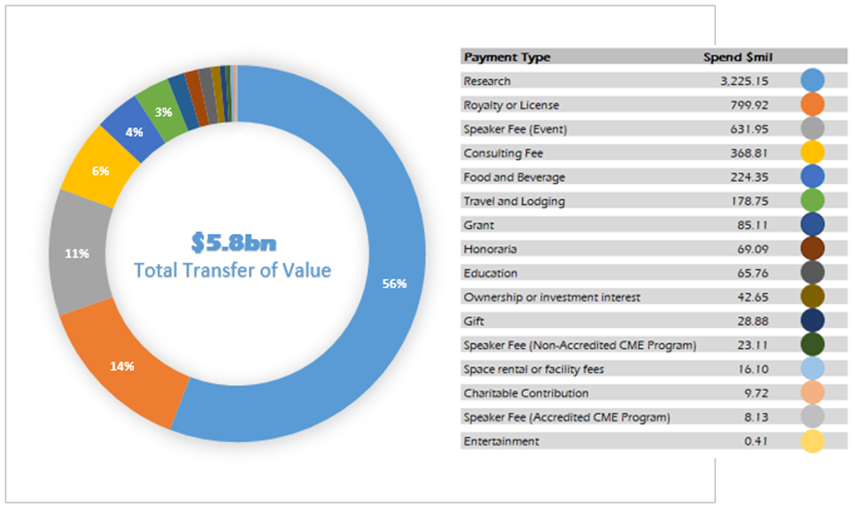
IN A SAMPLE YEAR, PHARMACEUTICAL AND DEVICE MANUFACTURING COMPANIES PAID $5.8 BILLION TO HEALTHCARE RECIPIENTS $3.2 BILLION TOWARDS RESEARCH AND $2.6 BILLION TOWARDS ROYALTIES, SPEAKER FEES, CONSULTING FEES, EDUCATION PROGRAM, GIFTS, MEALS AND TRAVEL.
We used public data from CMS to perform a variety of exploratory data analyses – for the industry as well as, specifically for a corporation. Such analyses can not only present competitive advantage but also offer unique opportunities for self-regulation and provide more business insight.
Our analyses of CMS data presented unique opportunities to our client for self-regulation and insights into their competitive position.
Learning from Competitor’s Data
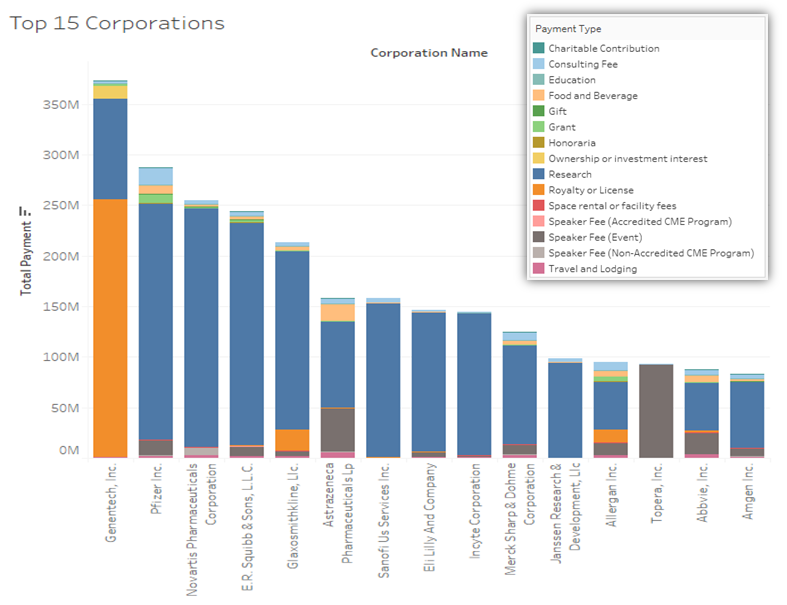
1. The quickest win is to find your competitive position in the industry. For instance, here are the top 15 pharma/Medical Device corporations with highest transfers of value
2. Find physician networks –
- HCPs interacting with your corporation as well as competing corporations.
- HCPs interacting only with competing drugs/devices.
- Find influential HCPs within specialties.
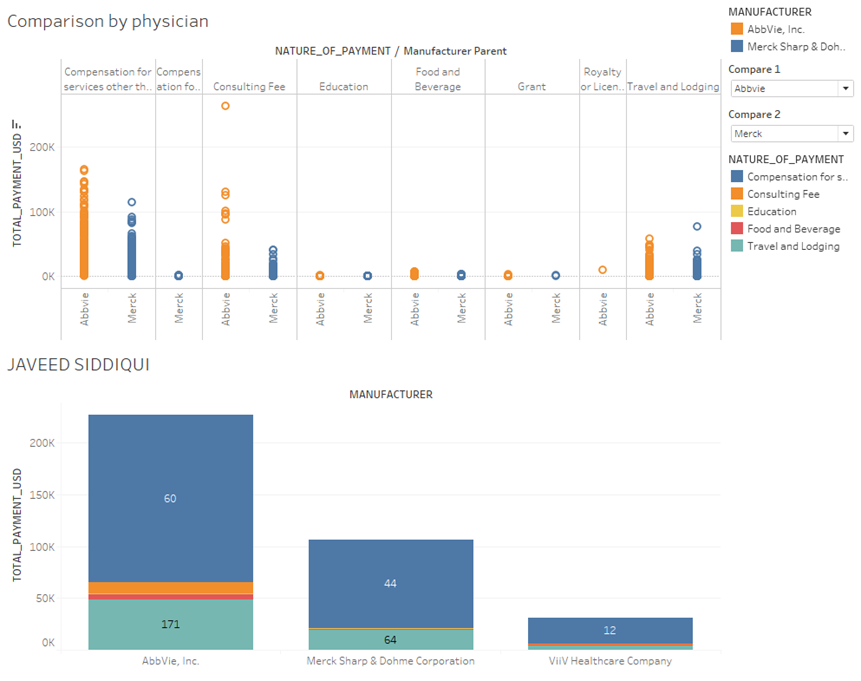
For instance, in the following visual we compared spend between two prominent manufacturers, AbbVie and Merck. By narrowing down our focus on a significant physician, we were able to visualize his network of manufacturers. Specifically, although HCP Siddiqui interacts primarily with AbbVie, he also interacts with Merck and Viiv Healthcare.
Easily find network of manufacturers linked to physicians you interact with
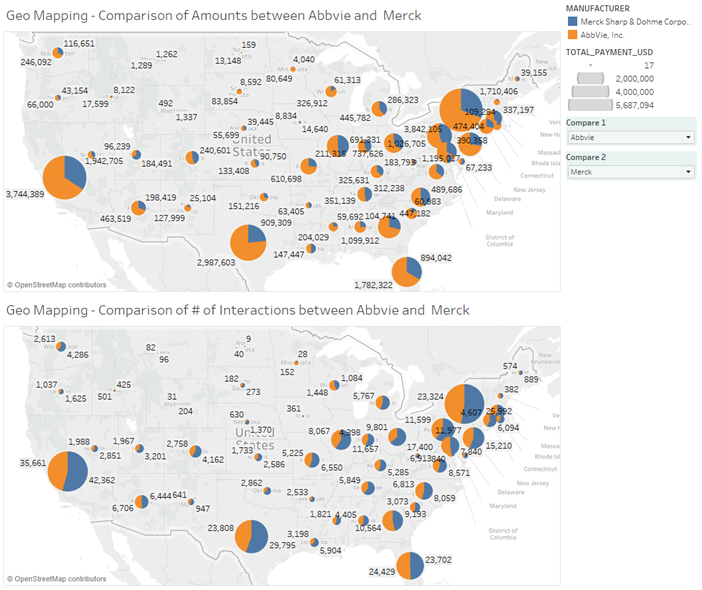
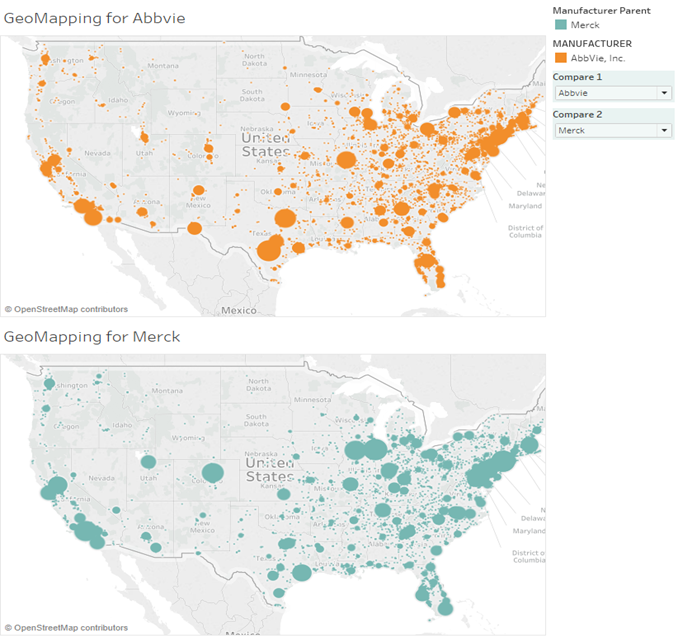
3. Geo- mapping the spend allowed our client tremendous insights on competitive presence and ability to ask relevant questions –
- Are HCP interactions clustered around field offices?
- Are there unexplored markets?
- Which regions are competition heavy and might need more presence?
In the following maps we visualized number of interactions and total spend by State as well as Zip Code for the same two prominent pharmaceutical players.
Geo-mapping is a useful tool to ascertain your competitive presence and find unexplored markets
4. Combine open payments data with other public data like Medicare to determine cause and effect –
- Is there a correlation between HCP spend and prescribing practices?
- Instances of low prescriptions despite high HCP spend lend opportunities for feedback and information exchange.
Self-Regulation
We used open payments data in conjunction with the client’s private data to arrive at analyses that helped examine internal processes around sales activity. Key questions and observations follow.
CMS data used along with client’s private data helped examine internal processes around sales activity, regulate and improve practices
1. Compare physicians with few interactions and high spend vs many interactions with low individual spend. We observed HCPs with over 200 interactions a year with the same manufacturer for an average of $800 per interaction. On the other end of the spectrum, we also observed HCPs with 2 interactions a year for an average of over $100,000 per interaction.
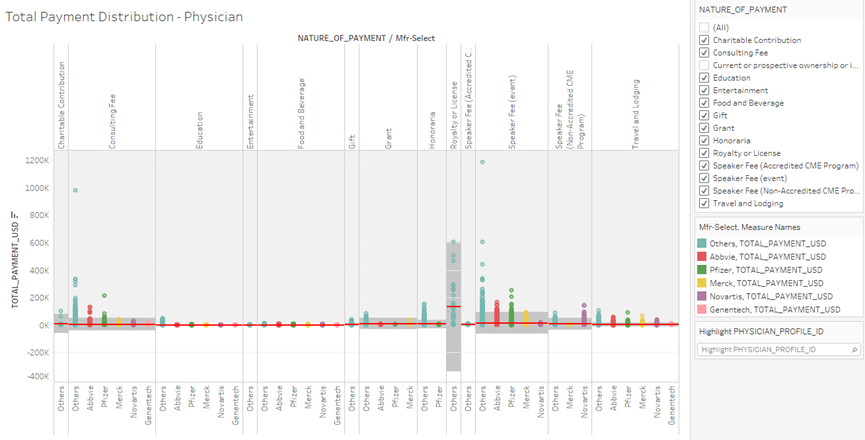
2. We extended this analysis to determine mean and median interaction spend per nature of payment or per physician specialty. For ex, the red line in the chart below denotes average spend per interaction for each nature of payment. As evident, many interactions fall well outside 3 standard deviations (gray bars)
Review interactions between sales rep and HCPs
3. We combined CMS open payments data with the client’s private data to find associations between sales reps and HCPs and help review policies around sales activities. Some of the findings included –
- Same sales rep having a meal with same HCP more than 50 times a year
- Same HCP interacting with the client on the same day but in more than one city
- Sales reps logging HCP interactions over 150 times a year, engaging as many as 500 HCPs
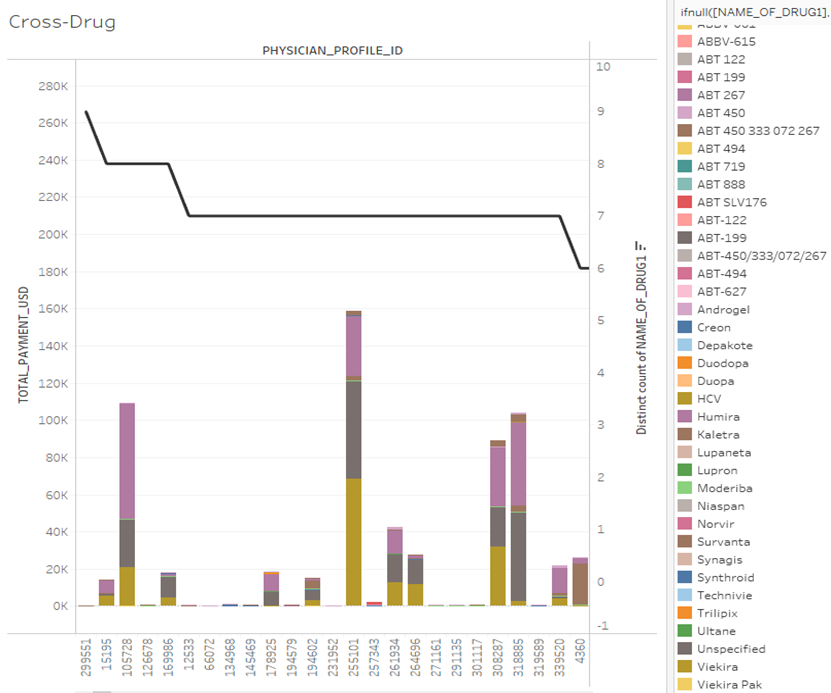
4. Cross-Drug Spend – we noticed physicians receiving payments for as many as 9 drugs from the same pharmaceutical company. This is conceivable if the drugs are from the same therapeutic area and can be easily discerned by the analyzing corporation.
From an industry perspective, we observed that top 5th percentile of the physicians interacted with as many as 29 drugs in a given year, and 20th percentile interacted with 10 drugs.
5. Is Drug/device accurately recorded when HCP interaction is captured? Is HCP’s specialty relevant to the drug/device’s therapeutic area?
MORE INFORMATION ABOUT OPEN PAYMENTS:
To bring greater transparency to the relationship between pharmaceutical/medical device industries and physicians/hospitals, The Sunshine Act2 in USA and EFPIA (European Federation of Pharmaceutical Industries and Associations) Code3 in Europe require applicable manufacturers to disclose any Transfer of Value (TOV) made to physicians and hospitals.
In the US, CMS (Centers for Medicare and Medicaid Services) published the first Open Payments dataset in 2014, which included data reported about payments made from August 1 through December 31, 2013. Full year of payment transactions for 2014 and 2015 Program Years can also be found on the Open Payments website.2
33 EU, EEA, EFTA and other countries, which are members of the EFPIA Code, published their first disclosures on 30 June 2016, for payments made in 2015. This information is mostly published on a public platform, which could be on the company’s own website or in some countries, a central platform combing data from different companies.3
REFERENCES:
1 http://www.pewtrusts.org/en/about/news-room/press-releases/2014/09/30/pew-welcomes-first-release-of-physician-industry-data

Be the first to write a comment.